
Ethereum has slipped toward $2,680 as traders wait for U.S. inflation and employment data, while high Treasury yields and renewed U.S.-Iran tensions continue to weigh on risk markets.
Summary
- Ethereum trades near $2,680 as higher Treasury yields and geopolitical tensions pressure risk assets today.
- Spot Ethereum ETFs posted $2.81 million outflows, ending their seven-session inflow streak on September 29.
- Analyst Ted sees $2,800 as breakout resistance while $2,550 remains the key downside trigger level.
- Ethereum futures open interest stands near $33.6 billion as traders reduce leverage before U.S. data.
- U.S. PCE inflation arrives Wednesday, followed by September employment data on Friday, raising volatility risks.
CoinGecko data put ETH near $2,680 during Wednesday trading, leaving the asset lower over both the 24-hour and seven-day periods. CoinGlass shows Ethereum futures open interest near $33.63 billion, with 24-hour futures volume around $46.14 billion.
The latest decline follows Ethereum’s rejection from the $2,750-$2,800 region during September. Price remains above the $2,500 area that acted as resistance earlier this month, but buyers have yet to regain the latest swing highs.
Why is Ethereum price struggling below $2,800?
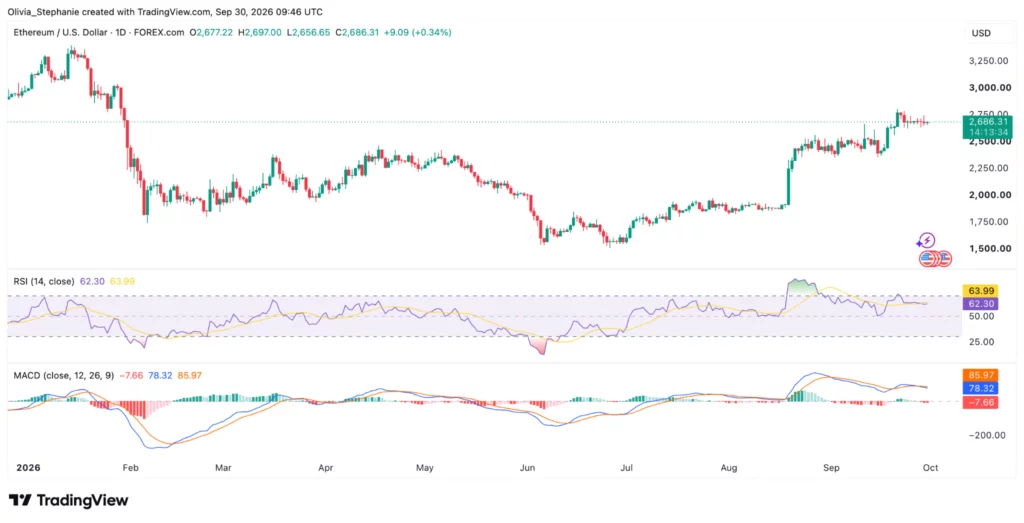
Ethereum’s immediate problem remains the $2,750-$2,800 region, where the September rally stalled. The daily chart places ETH near $2,690 after recovering from the June lows around $1,500 and forming higher lows through the summer.
A previous Ethereum rejection near $2,800 showed sellers stepping in around the same zone on Sept. 23. ETH reached roughly $2,789 before falling toward $2,648, leaving $2,800 as a level buyers still need to clear.
On the current daily chart, the 14-day RSI stands at 62.69, just below its moving average near 64.02. Momentum therefore remains above the neutral 50 level, although buying strength has cooled from earlier readings.
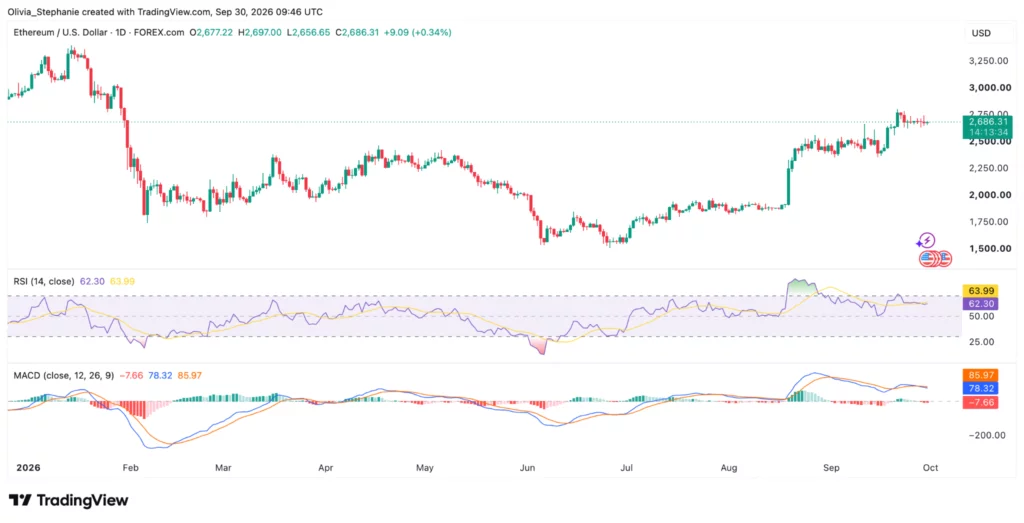
MACD tells a similar short-term story. The MACD line remains above zero near 78.71, but it sits below the signal line around 86.05. The histogram has slipped slightly negative to roughly minus 7.34, showing weaker momentum after the August-September advance.
Crypto analyst Ted wrote that ETH has been ranging since last week. In his view, a move above $2,800 could open another leg higher, while a break below $2,550 could lead to a sharper correction.
Those levels remain conditional analyst scenarios. ETH has not confirmed either breakout at current prices.
Can Ethereum price recover above $2,720?
Trader XO identified $2,720 as the nearby level that could reopen the upside. The analyst’s preferred setup has Ethereum reclaiming that price and rotating toward Monday’s highs before testing higher resistance.
Above $2,720, the analyst is watching the $2,900 region and the yearly opening level. Failure to regain the level would keep ETH inside a larger $2,300-$2,700 range, according to the same analysis.
Another chart setup places support between $2,650 and $2,710. Trader Symba described the structure as a possible bullish checkmate pattern, with buyers needing to defend the lower end of that area and push through $2,710 before the setup gains confirmation.
For the current price, $2,650 is therefore the closest support shared across several technical readings. Below it, $2,550 becomes more important, followed by the larger $2,500 level visible on the daily chart.
The upper side remains clearer. A sustained break through $2,750-$2,800 would clear the area that stopped Ethereum’s September rally and could bring $2,900 back into view.
Earlier Ethereum analysis around the $2,800 breakout level found ETH struggling with the same resistance while price held its former breakout support around $2,540.
Ethereum ETF inflow streak has ended
U.S. spot Ethereum ETFs recorded $2.81 million in net outflows on Sept. 29, ending seven consecutive trading sessions of net inflows. The previous session brought $17.1 million into the funds.
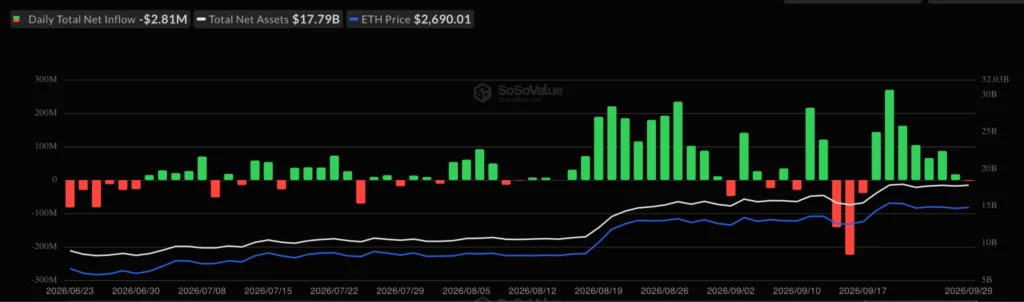
BlackRock’s ETHA posted the largest Sept. 29 outflow at roughly $8.94 million, while Fidelity’s FETH lost around $6.7 million. Grayscale’s Ethereum Mini Trust partly offset the withdrawals with approximately $12.83 million in net inflows.
The reversal follows a strong week for Ethereum investment products. During Sept. 21-25, spot Ether ETFs took in roughly $689.8 million, reversing the previous week’s outflow.
In recent coverage of Ethereum ETF demand and the $2,800 resistance zone, the funds had extended their inflow streak while ETH remained unable to sustain a move through its recent high. The Sept. 29 outflow ended that positive run but remained small compared with the prior week’s inflows.
ETF flows do not establish the cause of ETH’s daily price movements, but the Sept. 29 data show that the recent run of positive U.S. fund flows has paused.
U.S. data and Treasury yields remain in focus
U.S. macro data could bring another test for crypto markets. The Bureau of Economic Analysis schedules August personal income and outlays data, including the PCE inflation gauge, for Sept. 30 at 8:30 a.m. ET.
The Bureau of Labor Statistics lists the September employment report for Friday, Oct. 2 at 8:30 a.m. ET. September CPI is not due this week; the BLS calendar places that release on Oct. 14.
Treasury yields remain elevated before those releases. Reuters reported that the benchmark 10-year yield reached 5.293% on Tuesday, its highest level since 2007, while the 30-year yield touched its highest point since 2002.
Expectations for further Federal Reserve tightening have changed quickly. Markets had previously priced a path consistent with several more quarter-point increases by mid-2027, but New York Fed President John Williams said Tuesday there was “no need for urgency” after September’s rate increase. Reuters reported that his comments reduced expectations for an October hike.
Reuters reported Wednesday that traders were assigning around a 47% probability to an October rate increase and around 91% to a December increase before the PCE release. Those probabilities can change quickly after economic data.
U.S.-Iran talks remain another market risk
Geopolitical pressure has remained part of the market backdrop after U.S. President Donald Trump rejected an Iranian proposal involving the reopening of the Strait of Hormuz and an end to fighting.
The diplomatic situation has continued to change. Reuters reported on Sept. 30 that Iranian Foreign Minister Abbas Araqchi had received U.S. feedback through Qatari mediators on Iran’s proposed seven-day plan. Discussions were continuing over the sequence of possible steps, so the earlier rejection has not ended mediated contacts.
Oil and Treasury markets have reacted to the unresolved conflict. Earlier this week, elevated oil prices and U.S.-Iran tensions had helped keep Treasury yields above 5% while markets reassessed Federal Reserve policy.
For Ethereum, the immediate technical range remains more defined. Buyers face $2,720 first, followed by $2,750-$2,800. Ted’s bearish trigger sits at $2,550, while the daily chart leaves $2,500 as the larger nearby support if selling pressure increases.
Disclosure: This article does not represent investment advice. The content and materials featured on this page are for educational purposes only.