
Ethereum price has dropped toward the $1,600 level despite reports that Tom Lee-backed BitMine acquired another 75,000 ETH worth roughly $123 million, as traders continue reducing risk ahead of the latest U.S. inflation data.
Summary
- Ethereum price fell toward $1,600 despite reports that BitMine purchased another 75,000 ETH worth roughly $123 million.
- BitMine’s ETH holdings could rise to nearly 5.62 million ETH, bringing the company closer to its 5% supply target.
- Technical charts highlight $1,550 as a key support level, while ETF outflows and macroeconomic uncertainty continue to weigh on sentiment.
According to market data, Ethereum (ETH) traded near $1,627 at press time after falling almost 4% over the past 24 hours. The token has now declined roughly 14% from its June high near $1,890 and remains about 66% below its 2026 peak around $4,800 recorded earlier this year.
ETH’s latest weakness emerged ahead of the May Consumer Price Index report, with uncertainty around inflation and Federal Reserve policy keeping pressure on risk assets across both crypto and equities.
Despite the selloff, one of Ethereum’s largest corporate holders appears to have continued adding to its position. Lookonchain identified fresh transfers of approximately 75,000 ETH from Kraken and FalconX-linked wallets into addresses associated with BitMine.
The transaction, valued at about $123 million, followed the company’s June 8 treasury update showing holdings of 5.54 million ETH, equivalent to 4.59% of Ethereum’s circulating supply. If confirmed as an additional purchase, BitMine’s balance would increase to roughly 5.62 million ETH, or 4.66% of supply.
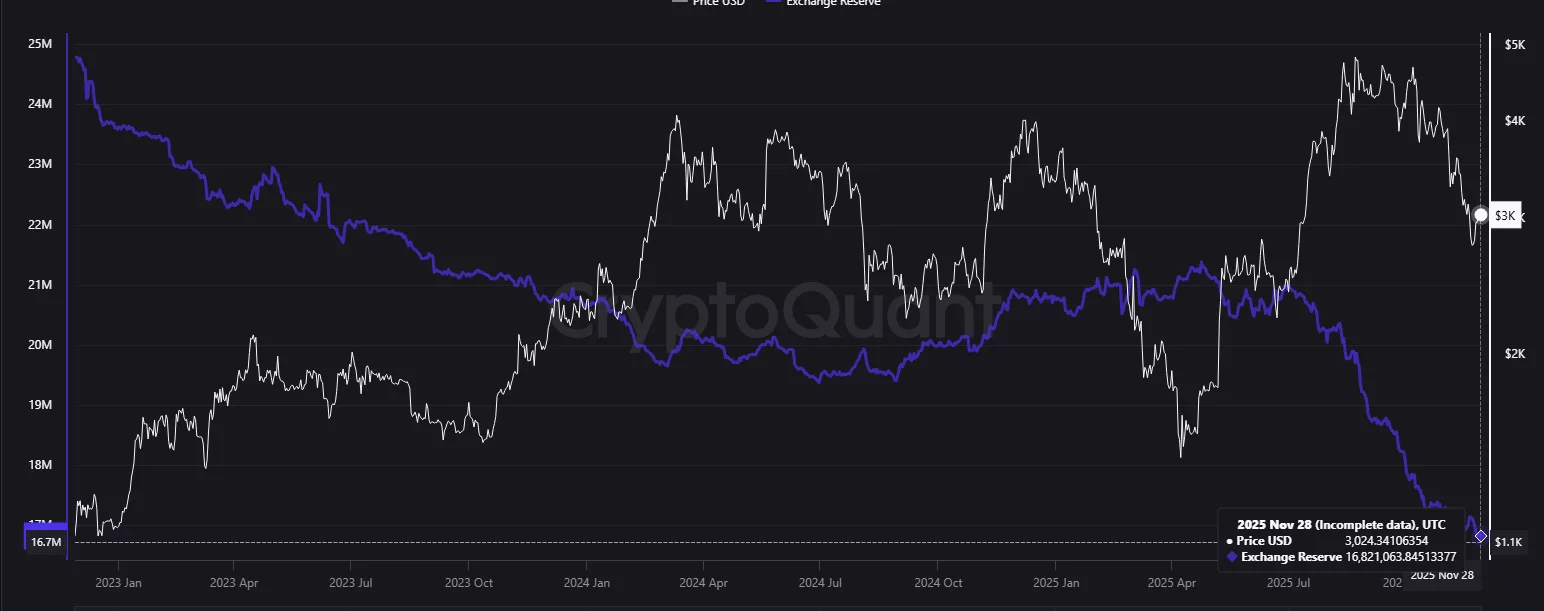
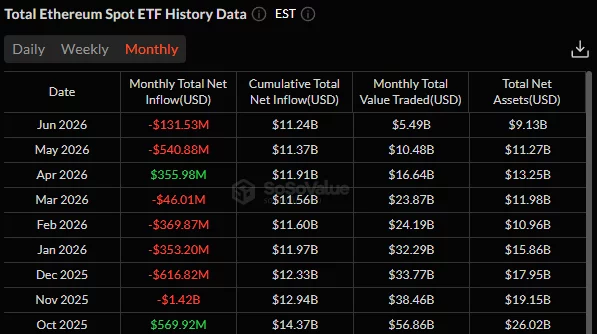
Corporate accumulation has accelerated even as exchange-traded fund demand remains weak.
Data from SoSoValue shows U.S. spot Ethereum ETFs recorded net outflows of $540.9 million in May and another $131.5 million so far in June. Total ETF assets have fallen to $9.13 billion from more than $15 billion at the beginning of the year.

Rising oil prices and continued tensions in the Middle East have added another layer of uncertainty for crypto markets. Traders have also adjusted rate expectations after a series of resilient U.S. economic reports reduced hopes for near-term monetary easing, keeping pressure on speculative assets such as Ethereum.
BitMine buying contrasts with bearish derivatives positioning
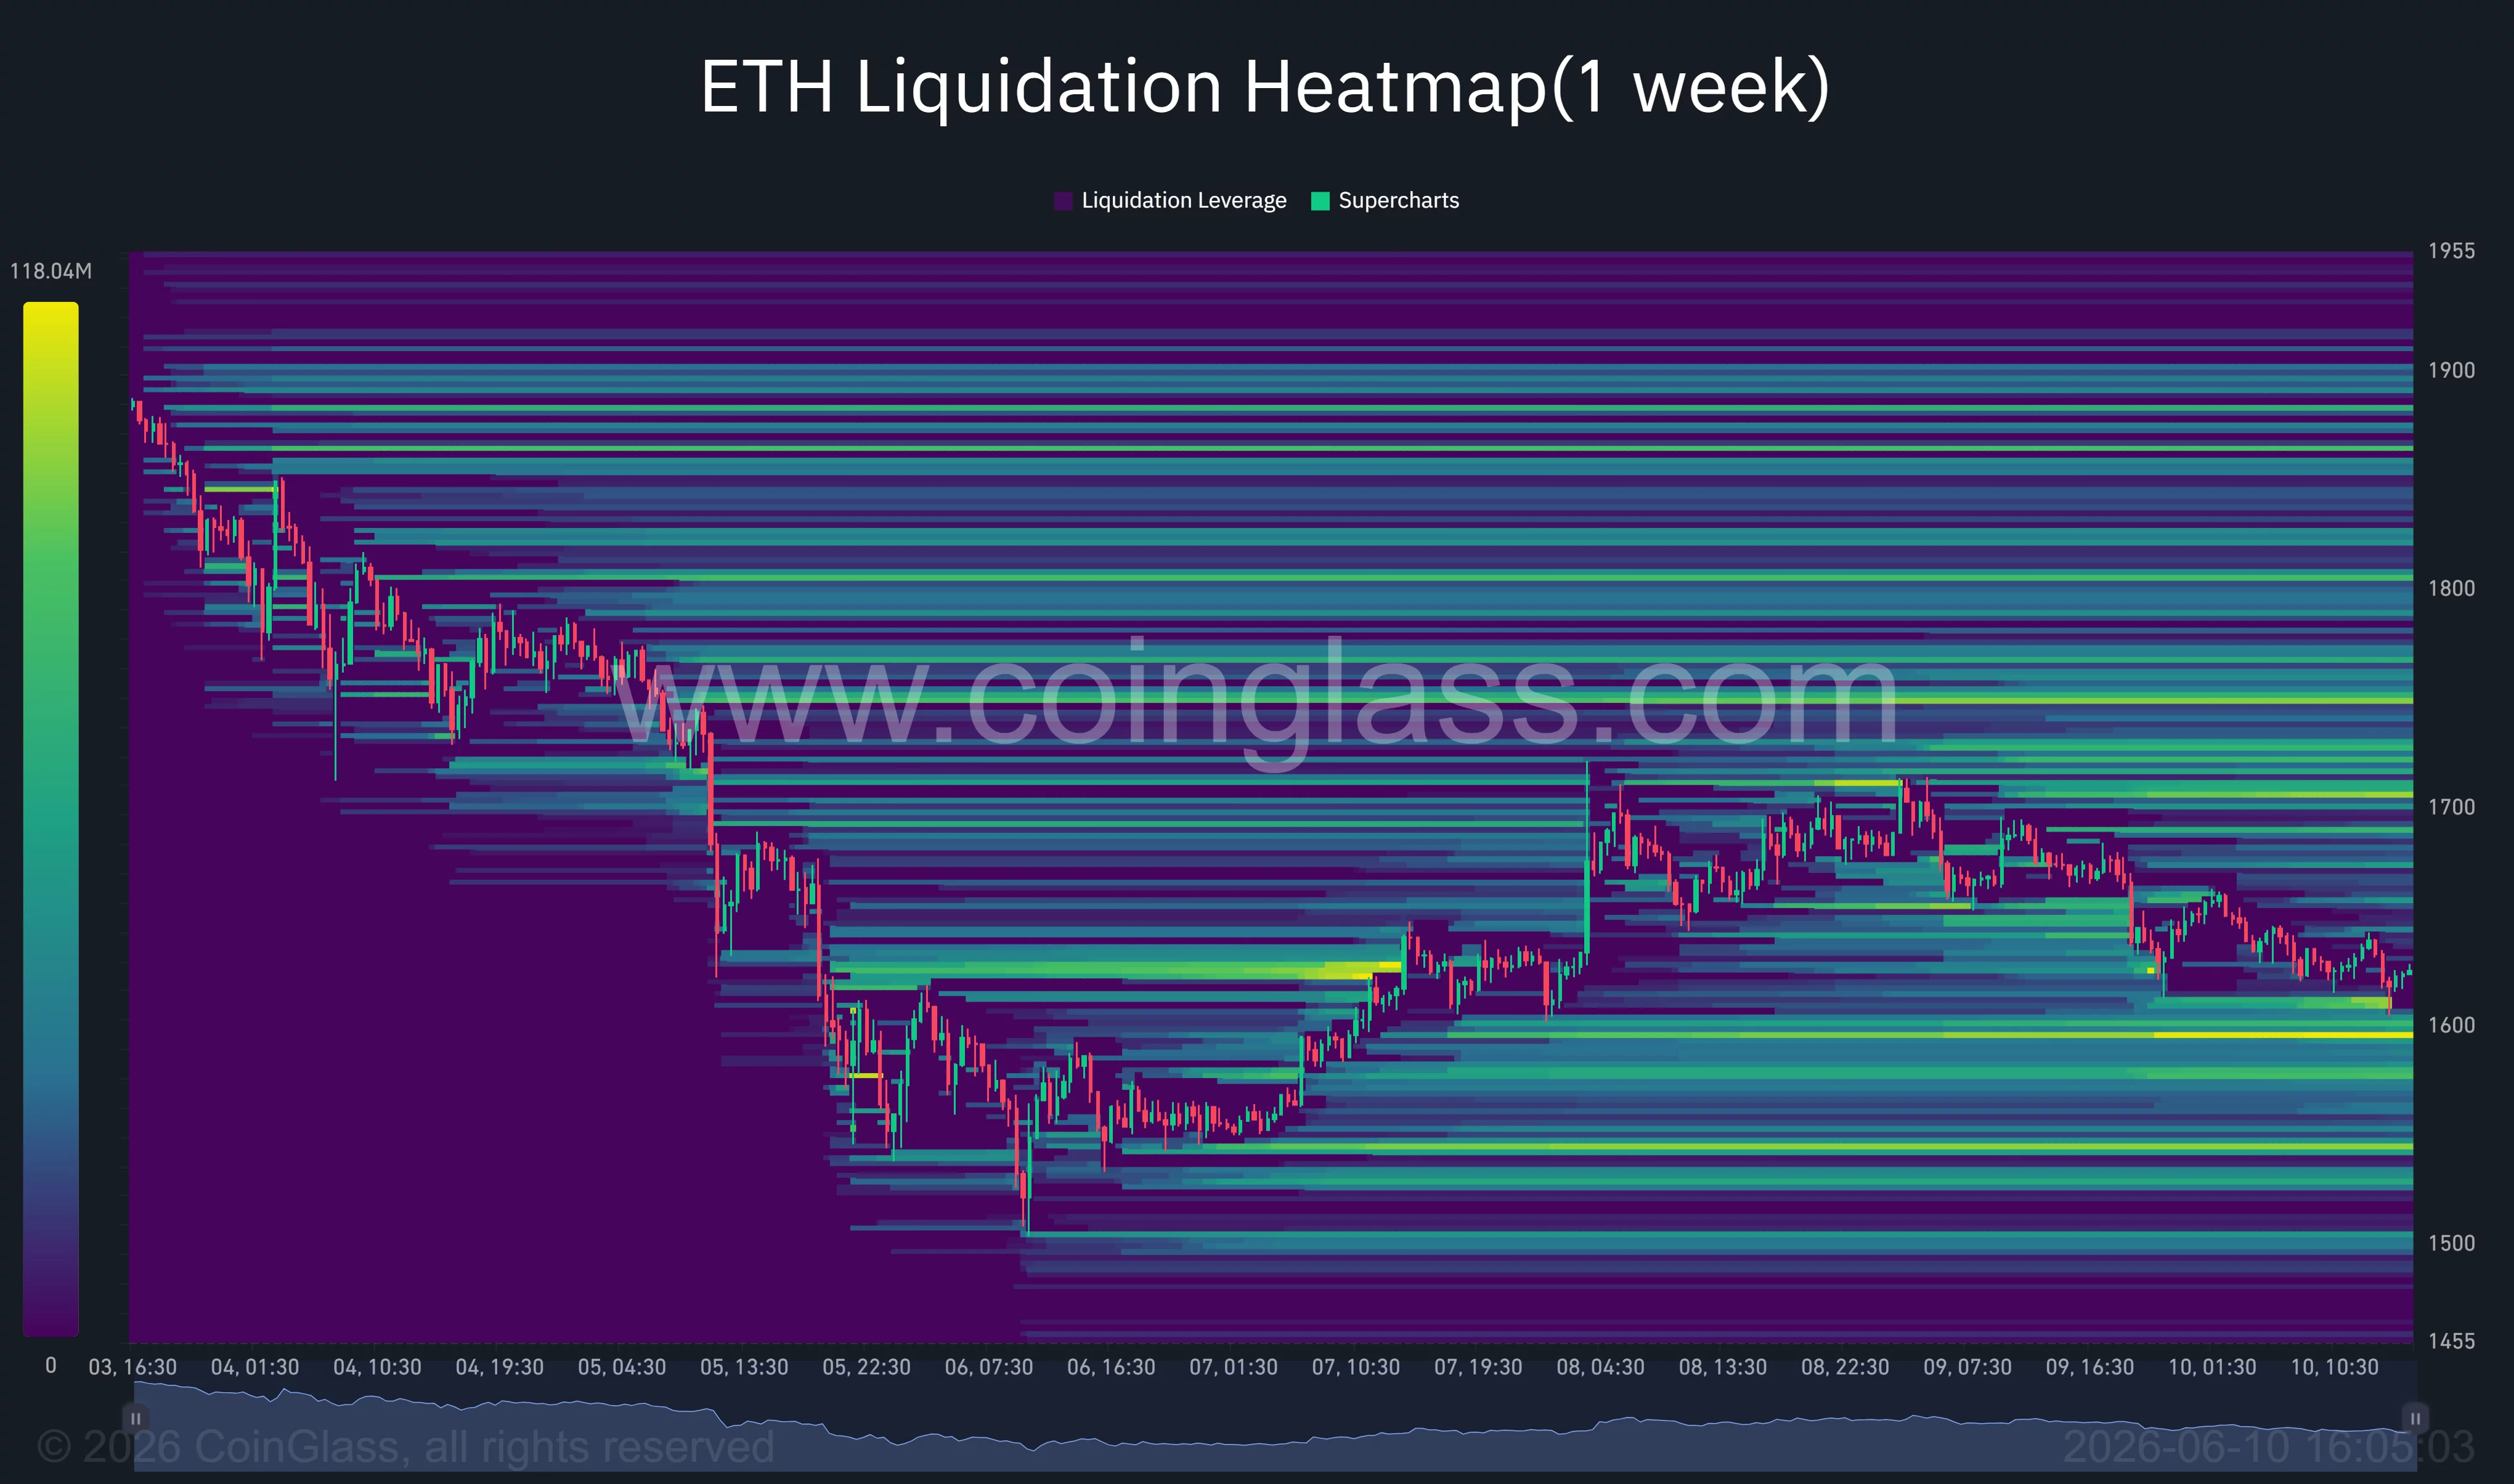
BitMine’s latest purchase arrives at a time when futures traders continue cutting exposure. Ethereum open interest has fallen sharply from recent highs, while liquidation activity remains concentrated around key technical levels.
CoinGlass liquidation heatmap data shows large leverage clusters sitting between $1,700 and $1,760, with another major concentration near $1,800. A move into those zones could trigger forced short liquidations and increase volatility. On the downside, liquidity remains concentrated around $1,550 and $1,500, creating potential magnets if sellers maintain control.
Market sentiment remains divided. According to crypto analyst Ali Martinez, Ethereum has entered a historically attractive accumulation area based on on-chain valuation metrics.
“Ethereum $ETH below the 0.8 MVRV Pricing Band is a high-probability long-term accumulation zone. Buy the dip!”
An accompanying chart shared by Martinez showed that Glassnode’s 0.8 MVRV Pricing Band sits near Ethereum’s current price. Previous declines below the level have often coincided with long-term market bottoms and accumulation periods.
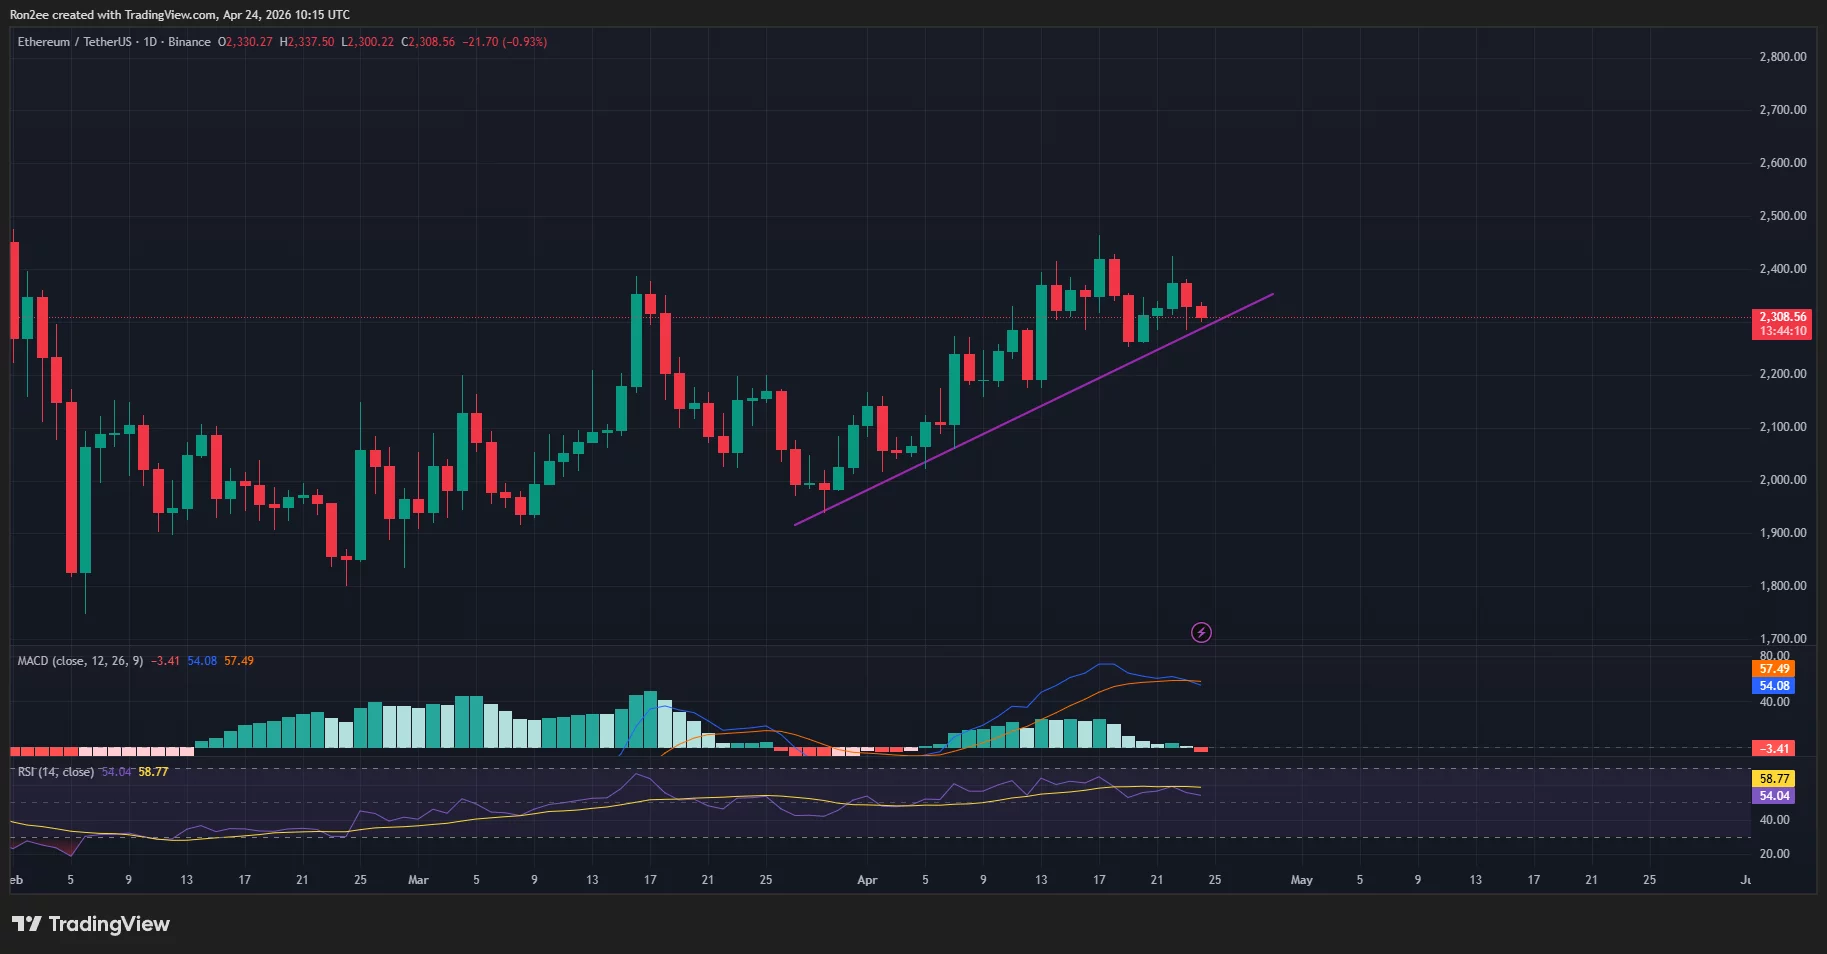
Technical charts place focus on $1,550 support
Weekly charts show Ethereum trading just above a major support region that has held since late 2022. The area between $1,510 and $1,620 now represents one of the most important technical zones on the chart.
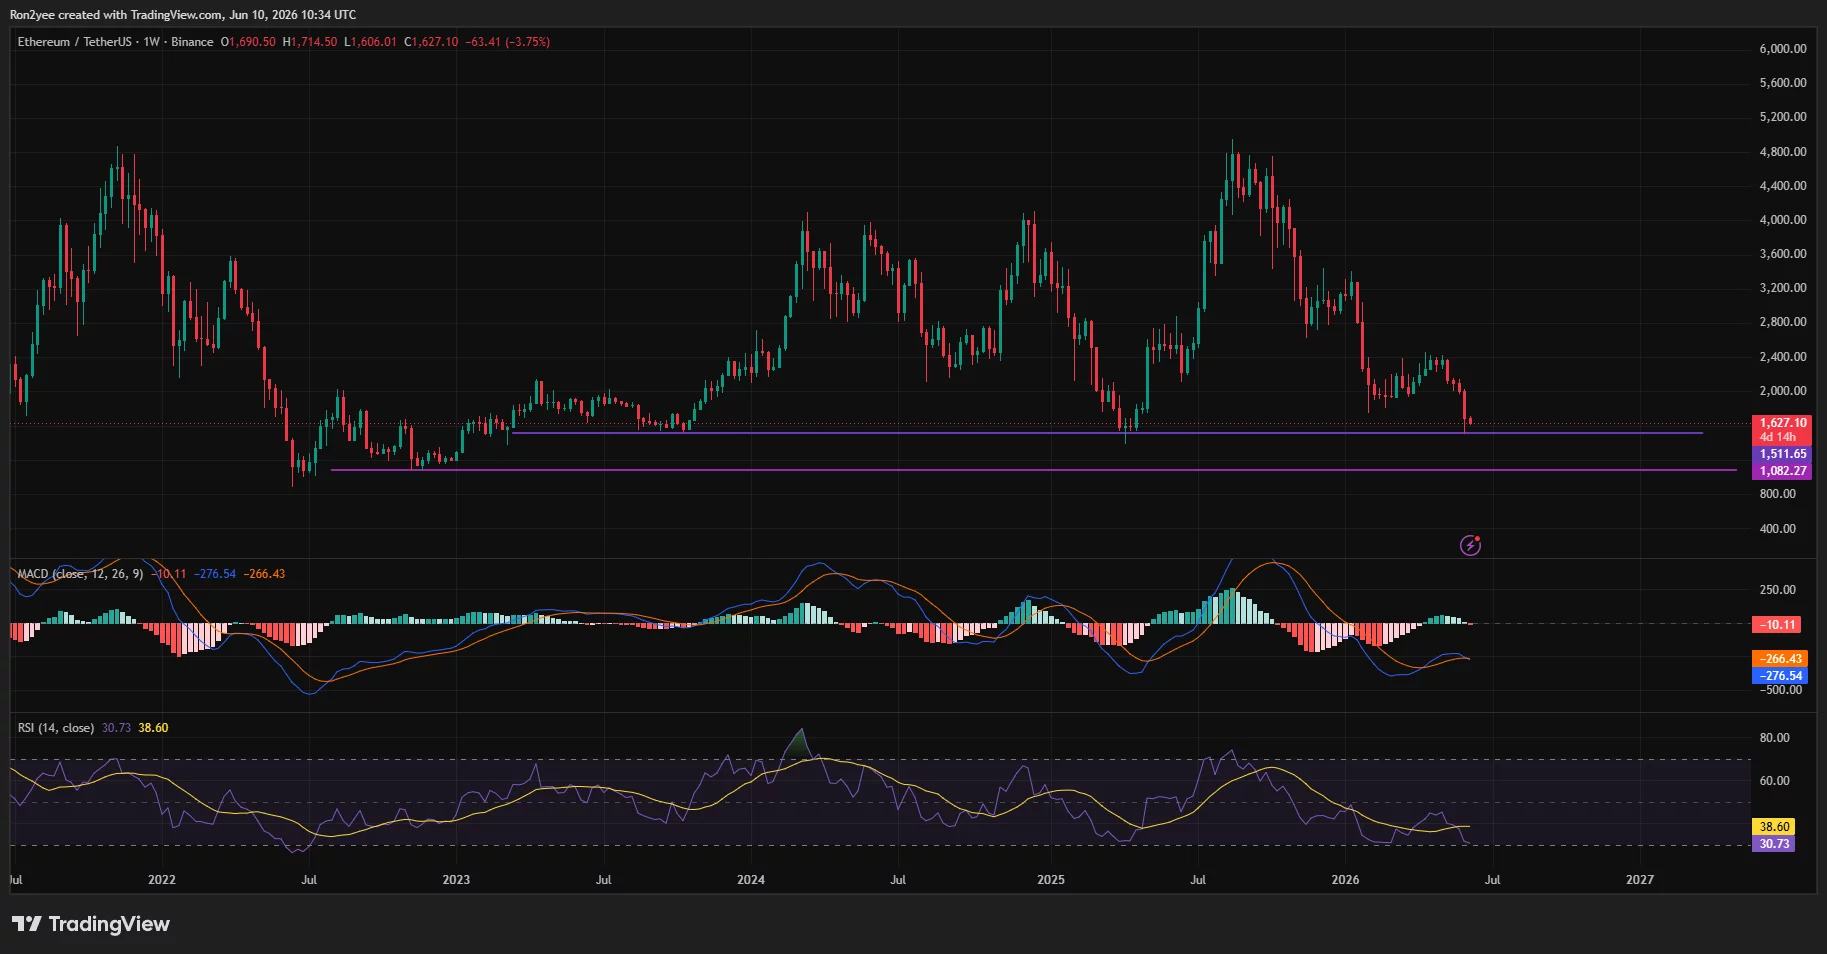
Momentum indicators continue to favor bears. The weekly RSI has fallen to around 30, placing Ethereum near oversold territory, while the MACD remains below its signal line and continues printing negative values.
Commenting on the latest structure, crypto analyst Ted Pillows noted that Ethereum failed to reclaim its February lows after the recent rebound attempt.
“$1,550 is the next support zone for Ethereum, and failing to hold it means ETH will dump to new lows.”
A break below $1,550 could expose the psychological $1,400 level, which also aligns with liquidity concentrations visible on derivatives exchanges. Conversely, reclaiming $1,700 would place the first major liquidation cluster in play, while a move above $1,800 could force a larger short squeeze.
For now, BitMine’s aggressive accumulation strategy is providing one of the few bullish counterweights to weak ETF flows, deteriorating momentum indicators, and a derivatives market that remains positioned defensively ahead of key macroeconomic data.
Disclosure: This article does not represent investment advice. The content and materials featured on this page are for educational purposes only.